Pinch to zoom · Double-tap to reset
Activewear
How Fit Tribe Scaled From E£8.67M to E£14.1M While TikTok CVR Fell 95%.
Fit Tribe was scaling fast, sessions up, TikTok spend increasing, more revenue every month. But as traffic scaled, blended CVR fell. General scaling dropped CVR ~16% on its own. TikTok, at 40% of traffic and converting at 0.1%, down from 2%, compounded the drag. We rebuilt product discovery in 30 days. Blended CVR held at 1.24% despite continued scaling. After TikTok budget was re-allocated, CVR reached 1.86%. Fit Tribe did E£143K in a single day last week.
424K
Q1 Sessions
Up from 352K
E£14.1M
in 4 months
Up from E£8.67M (~$170K USD)
+166%
Est. CVR Growth
~0.70% estimated floor → 1.86% after re-allocation
The Brand
A high-volume activewear brand

Fit Tribe is an E£60M+ Egyptian activewear brand (~$1.18M USD) that built real traffic momentum on TikTok. By Q4 2025, they had 352K sessions and E£8.67M in revenue (~$170K USD), but TikTok traffic, which made up 40% of sessions, was converting at 0.1%. Their site wasn't built to absorb cold social traffic at scale.

Navigation was undifferentiated. Search was buried. Product pages didn't do the persuasion work needed for visitors with zero prior brand familiarity. TikTok traffic landed on collection pages with no clear path to the right product. Mobile visitors were dropping off before they ever made a decision.

Activewear Egyptian market E£60M+ brand
The Challenge
Scaling Traffic Lowered CVR by 52%, TikTok Accelerated the Drop.

General scaling across all channels dropped CVR ~16% from Jan 2025 to Jan 2026, independent of TikTok. On top of that, TikTok, 40% of traffic, had fallen from ~2% CVR to 0.1%. Together, blended CVR dropped from ~1.46% to ~0.70%, a ~52% collapse. [(1.46 − 0.70) / 1.46 ≈ 52%]

The site had no mechanism to recover those visitors. Navigation was undifferentiated. Search was buried. Product pages didn't do persuasion work. TikTok traffic landed on collection pages with no clear path to the right product. Mobile visitors were dropping off before they ever made a decision.

TikTok accounted for 40% of traffic and had a 0.1% conversion rate. That was the drag. Fix the site for cold traffic, and blended CVR goes up even as TikTok scales.

Q4 2025, Before
352K
Sessions
Revenue
E£8.67M
Q4 2025 baseline (~$170K USD)
Blended CVR
1.16%
Measured after TikTok had already started to underperform.
TikTok conversion rate
2% → 0.1%
Baseline TikTok CVR fall
The Approach
We optimized product discovery and navigation.

30-day sprint. We audited the full funnel and found the highest-leverage gap: visitors couldn't find exactly what they were looking for. Navigation, search, and collections weren't built for people arriving with intent but no brand familiarity. We rebuilt product discovery for all traffic, the fix served cold visitors and returning customers equally.

Search rebuilt as a discovery channel
Search was practically invisible, 30 total item searches at 0.016% of sessions. We elevated it in the UI, rebuilt the search modal with optimized product cards, and improved search suggestions. Search usage grew from 30 to 5,158 searches. 3% of users now use search, and they convert at 10.8%.
0.016% → 3% search usage 30 → 5,158 item searches 10.8% search CVR Est. E£900K+/month from search channel
Color options shown as real product images
Abstract color dots were replaced with real product images per variant. We linked products that shared the same silhouette but different colorways, then surfaced them as image swatches across PDPs and collection cards. Shoppers see exactly what they're buying before they click.
Image swatches across all PDPs Linked variant groups Faster product decisions Removes the biggest pre-click drop-off point
Cart rebuilt to convert, not just collect
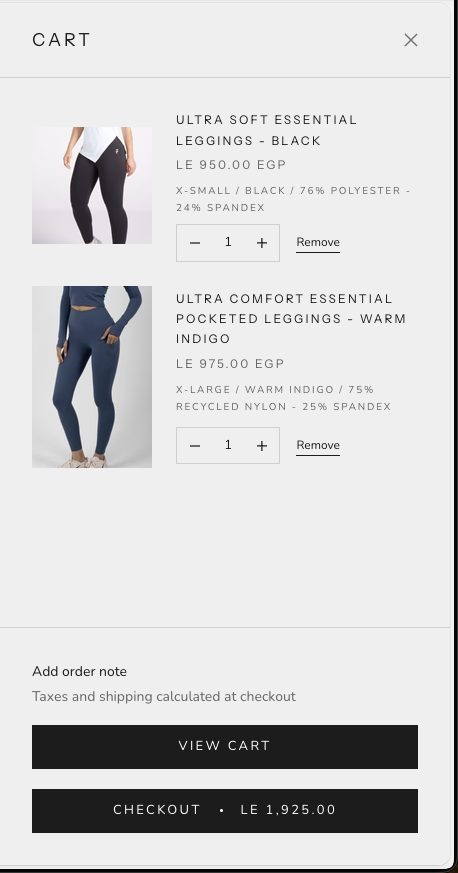
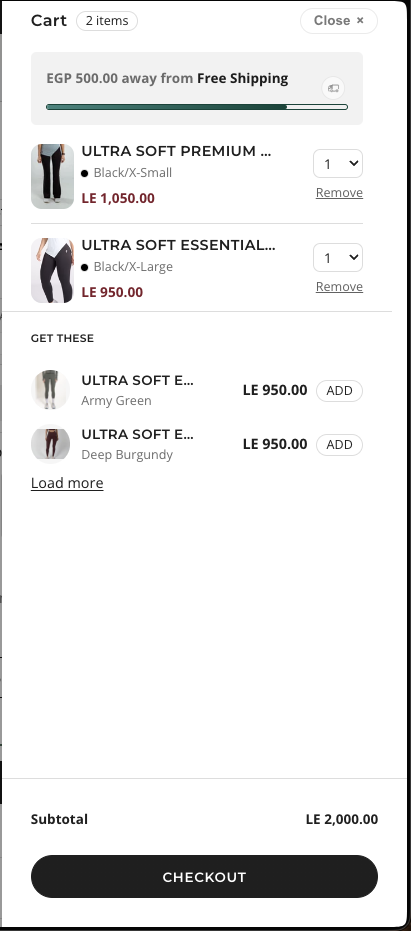
ATC abandonment was at 75.88%. We added a tiered rewards progress bar to create purchase momentum, rebuilt line items with visual color previews and price highlights, added cart add-on options, and handled pre-order/standard split checkout. ATC abandonment fell to 59%.
75.88% → 59% ATC abandonment Tiered rewards bar Cart add-ons ~70% more purchases per ATC event
Mobile navigation rebuilt for intent-driven traffic
The previous nav had no clear path for visitors arriving with intent but zero brand familiarity. We rebuilt it mobile-first: search in the nav, mega menu cards with product imagery, a support menu, returns portal, and re-routed all destinations to the highest-value pages. Bounce rate dropped, though TikTok's outsized volume made clean attribution difficult.
Mobile-first rebuild Mega menu + search Support + returns in nav Enabled 21% traffic scaling without CVR collapse
PDP rebuilt to close cold traffic
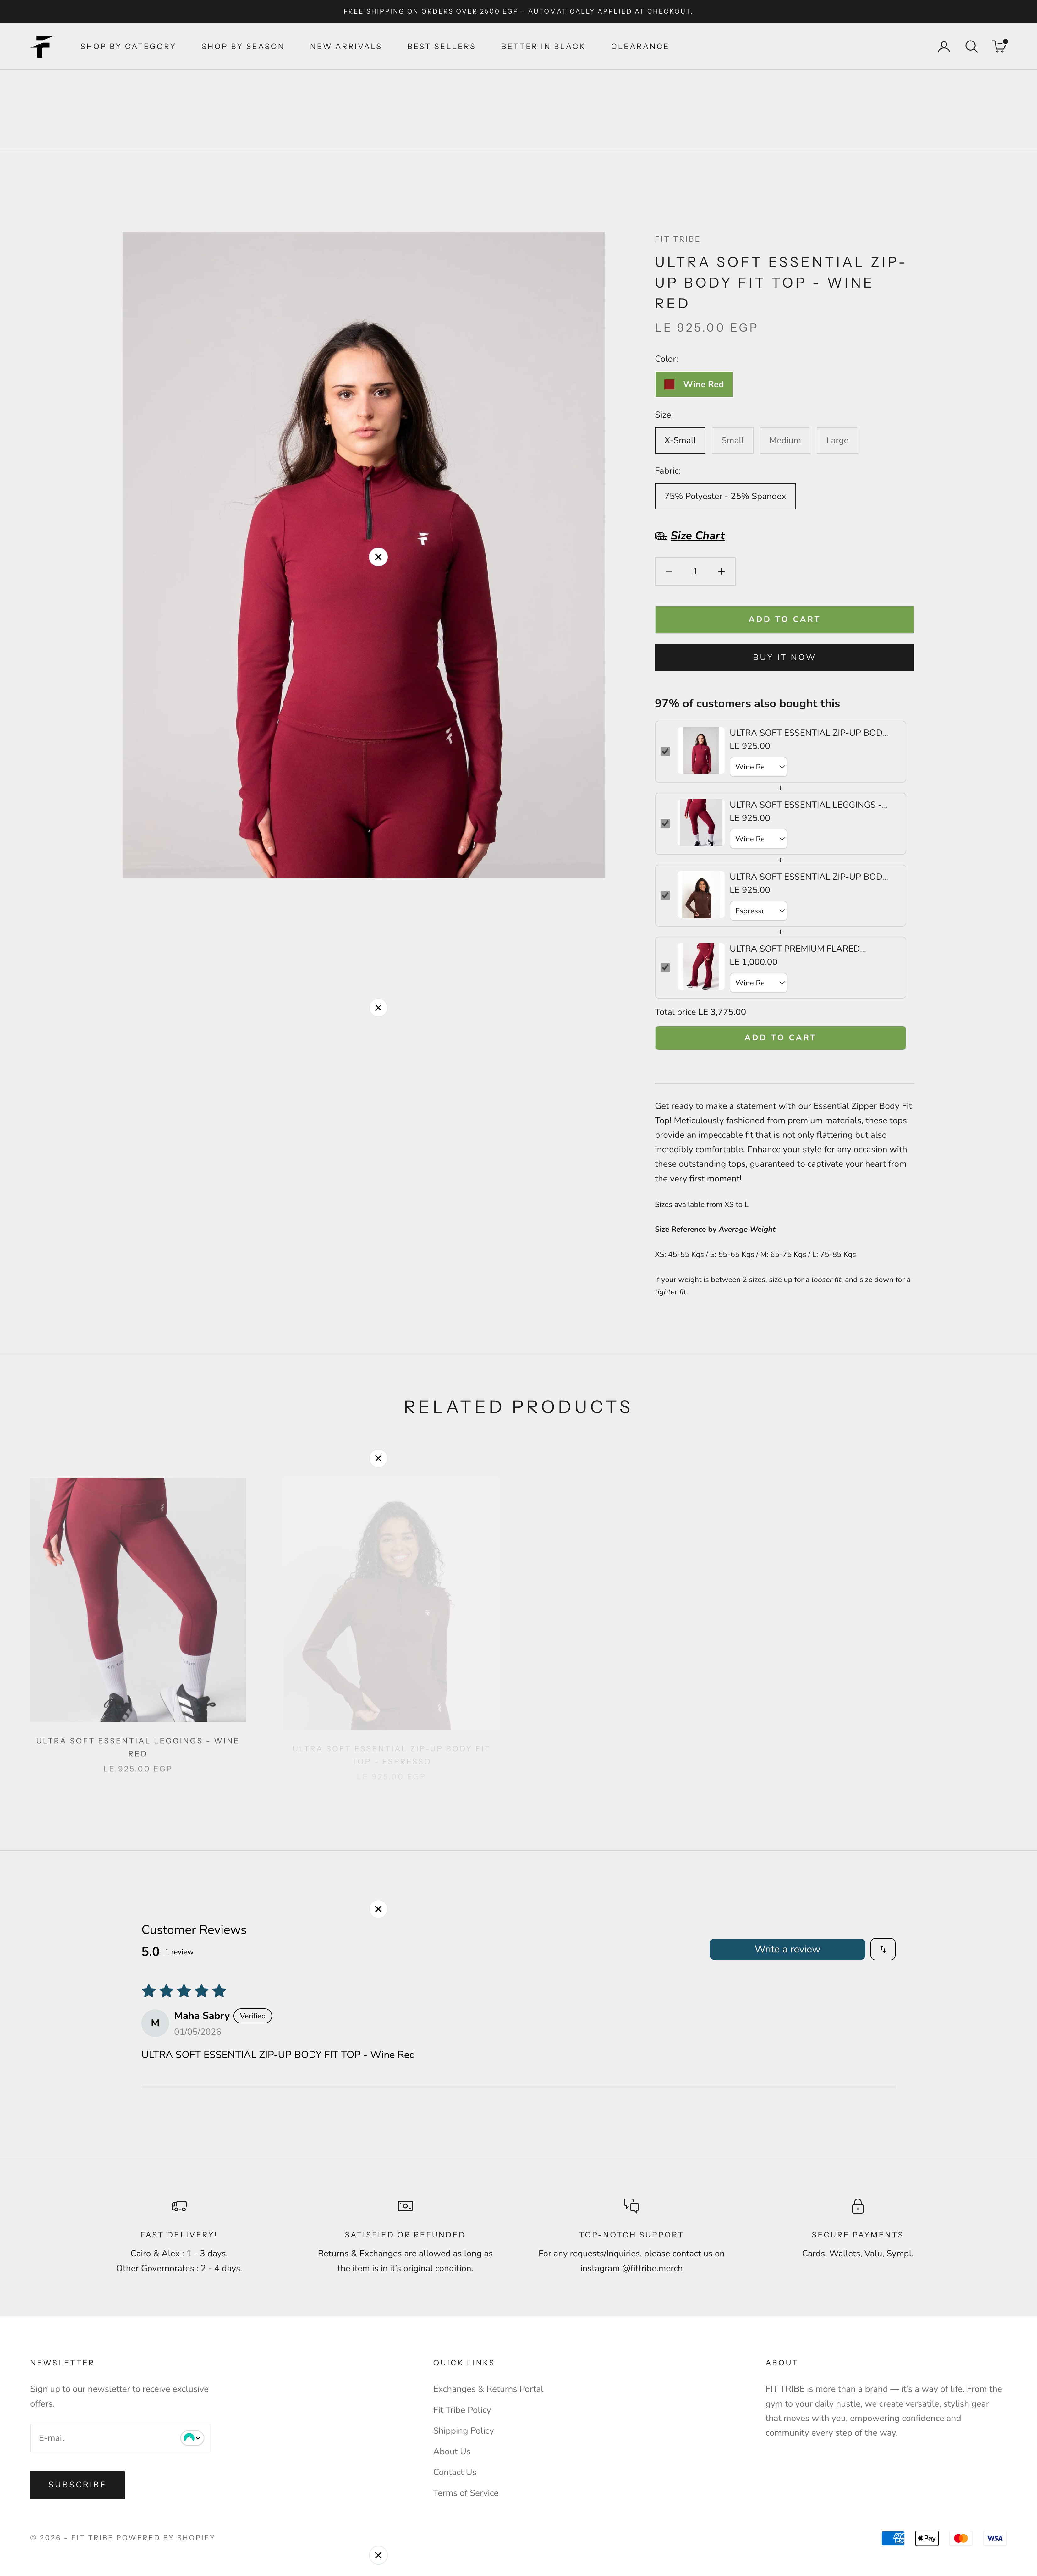
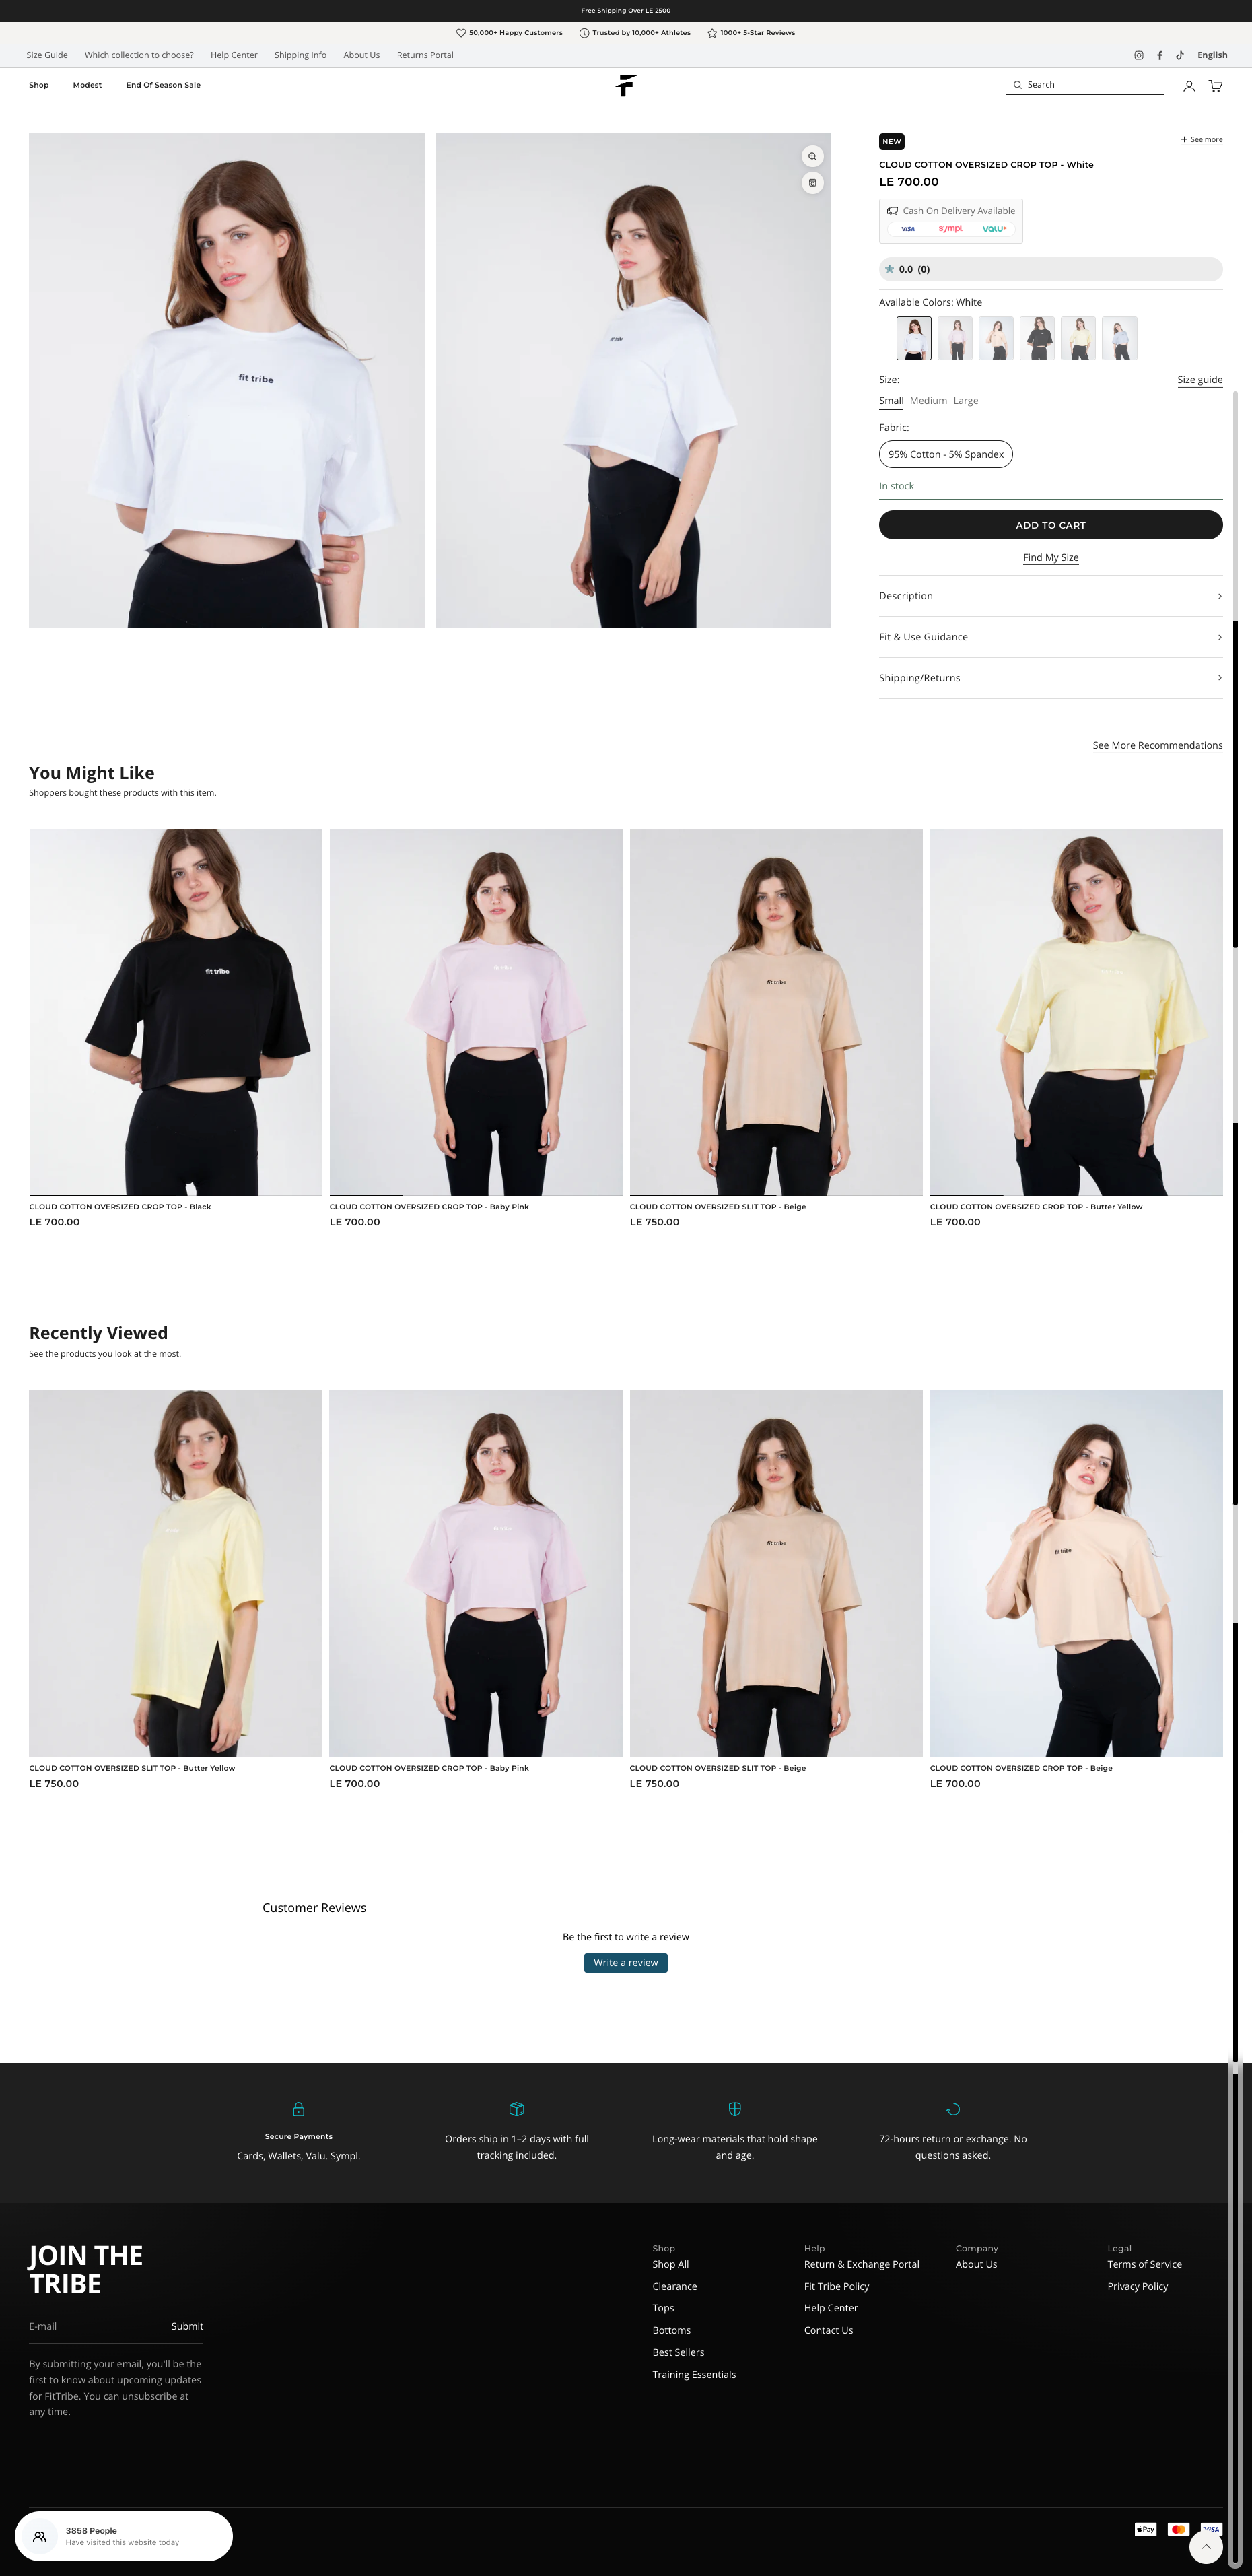
PDP abandonment was 95.9% in December 2025. We rebuilt the page entirely, image overlays for zoom and care instructions, a pill-design media gallery, product badges with a badge drawer, highlighted payment options, image swatches, optimized reviews, cleaner variant picker, inventory status, improved size guide, accordion descriptions, and a product recommendations + recently viewed section. PDP abandonment is now 67%.
95.9% → 67% PDP abandonment Full page rebuild Recommendations + recently viewed 8× more PDP visitors completing purchase
Collections rebuilt as a real discovery layer
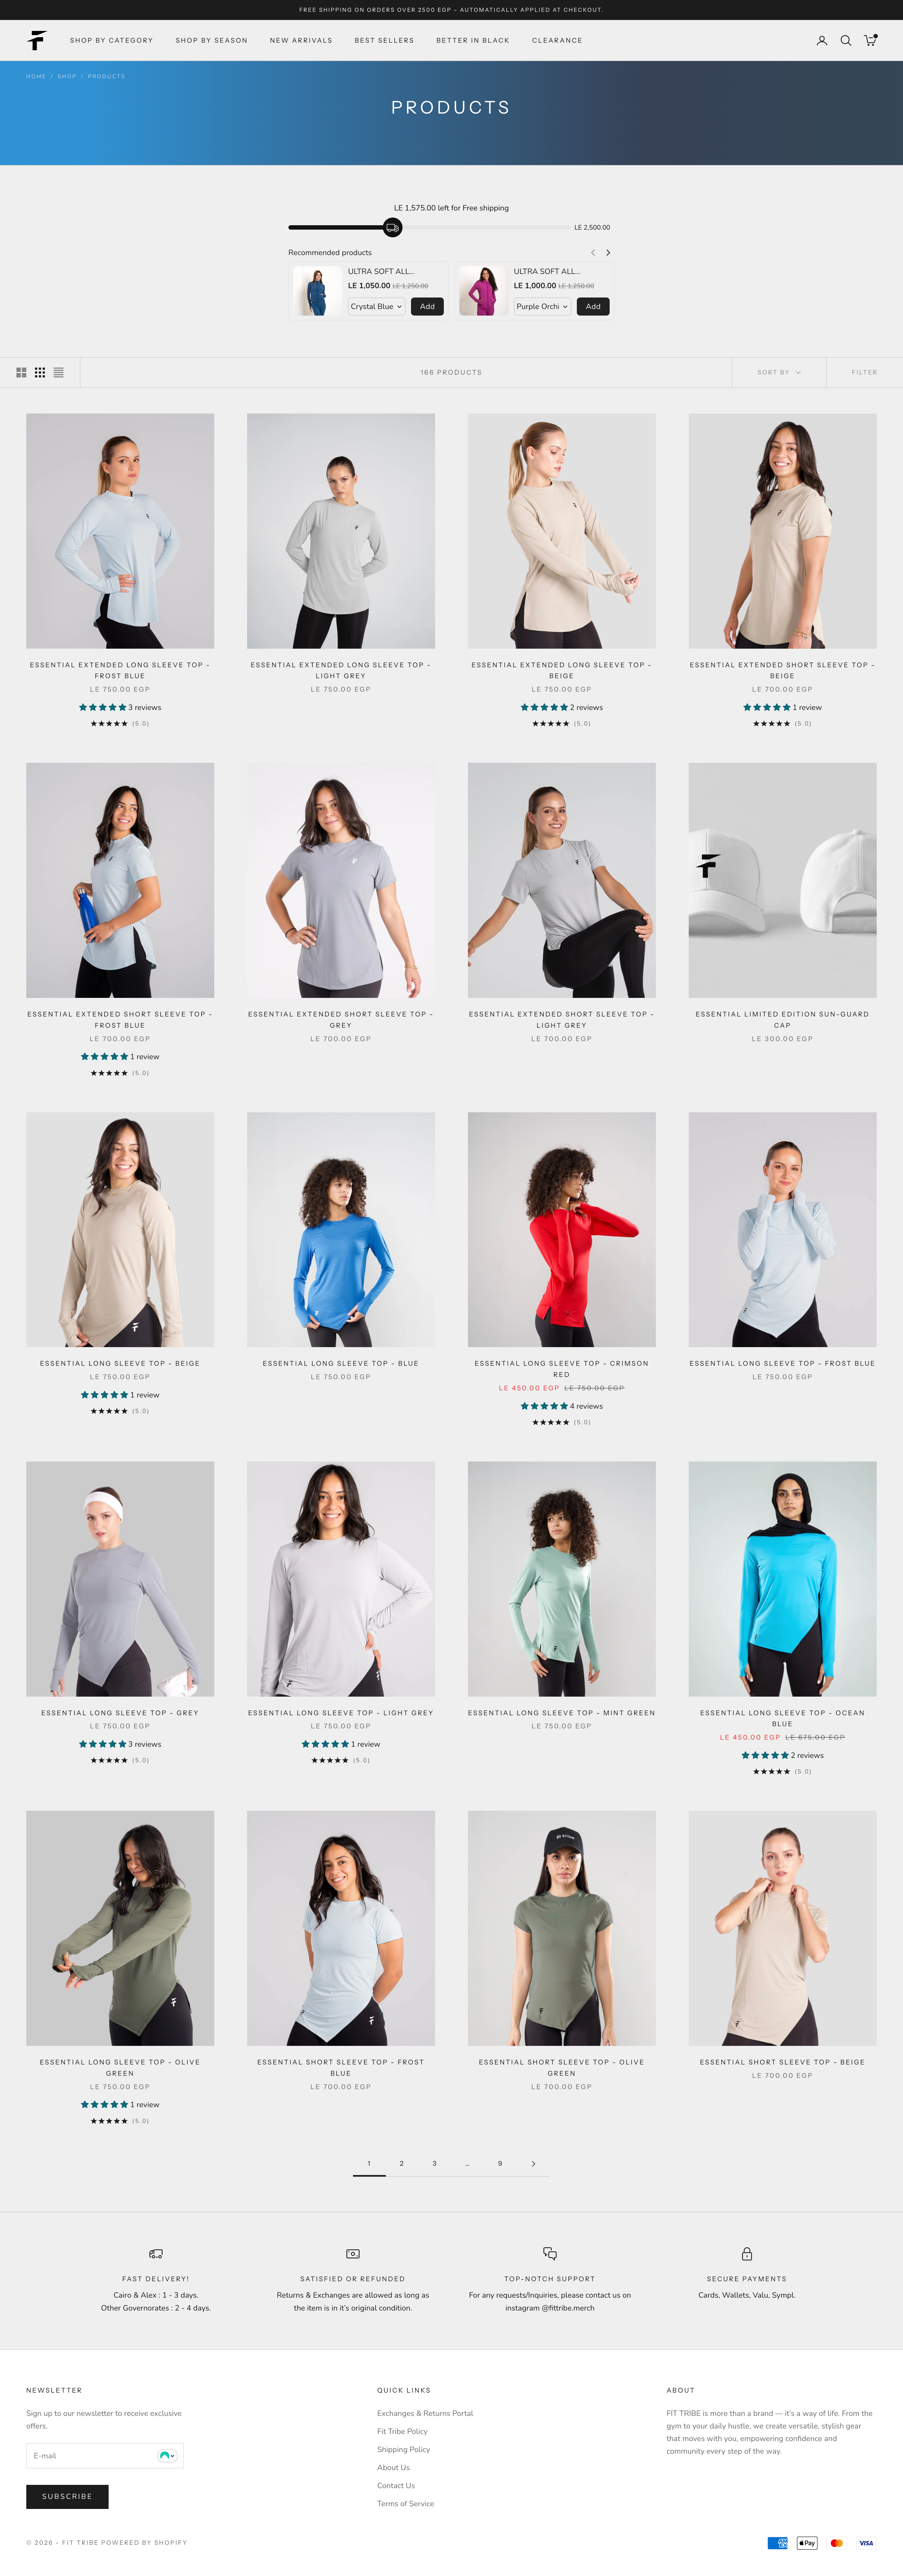
Large 100+ product collections had no real discovery infrastructure. We added subcollections, infinite scroll, spec-based filtering, image scrolling on product cards, a multi-step quick add with an info drawer before cart commitment, in-stock-only defaults, product tags, a features tab for badge control, and an optimized sorting menu. Collection abandonment dropped from 98.45% to 70%, and will fall further as ad traffic stabilizes.
98.45% → 70% collection abandonment Spec-based filtering Quick add with info drawer ~19× more collection visitors converting
The Funnel, Before & After
What the site looked like before. What it looks like now.

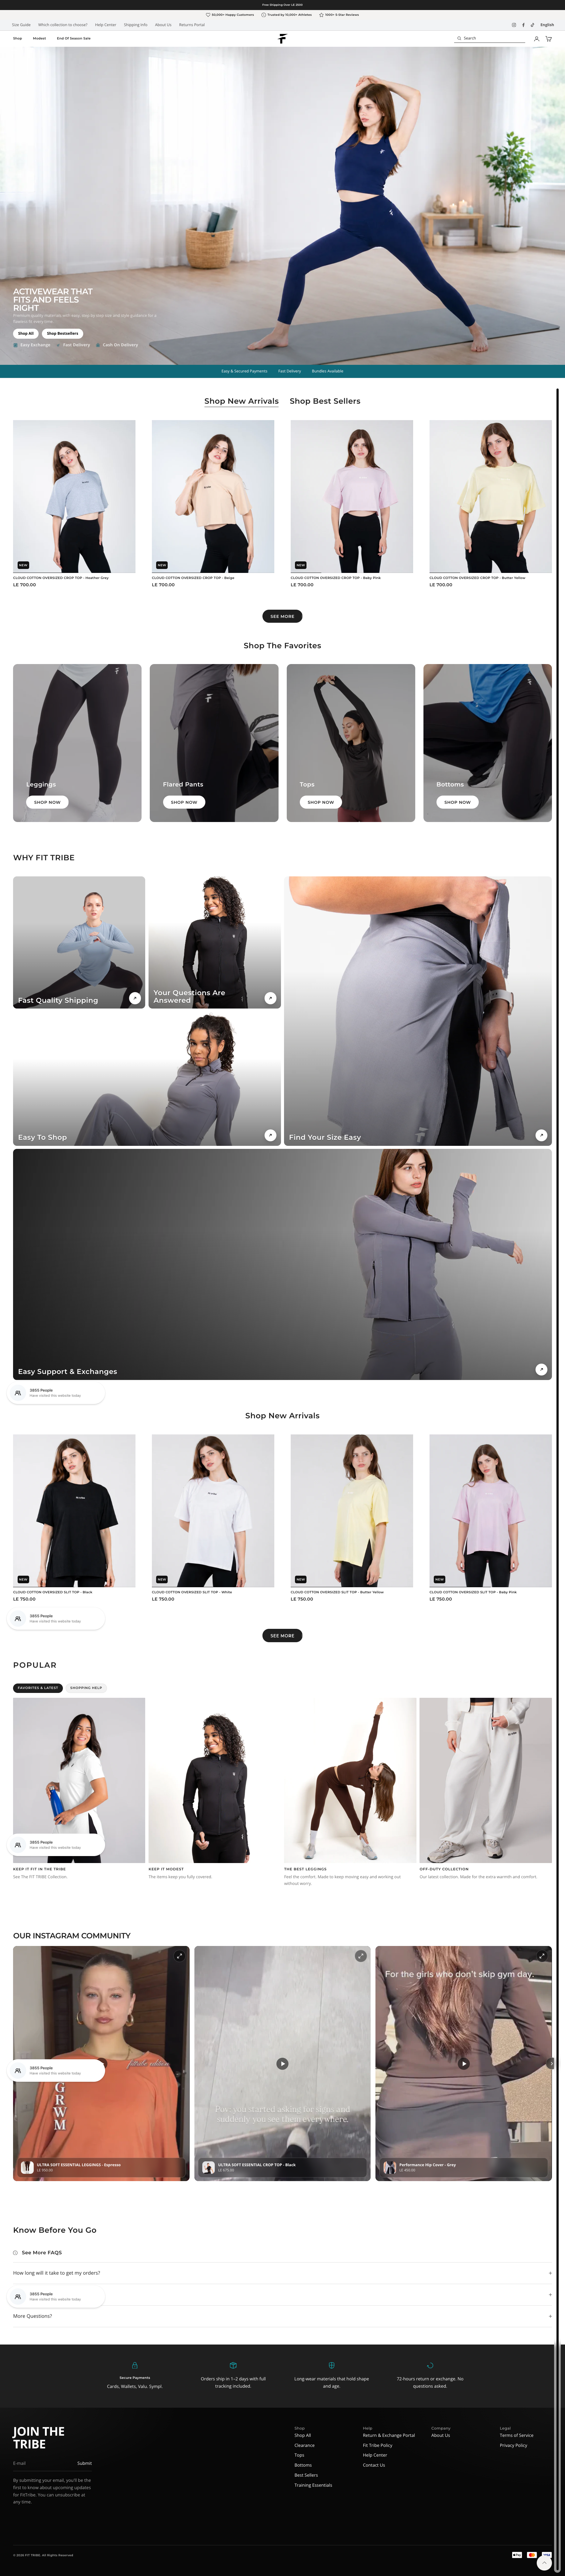
Every screen is a decision point. Here's how Fit Tribe's key funnel pages changed, homepage, collections, product detail, and cart.

01
Homepage
Navigation clarity + category-led hierarchy
Before Fit Tribe homepage before redesign
After Fit Tribe homepage after redesign
02
Collections
Filterable grid + faster discovery
Before Fit Tribe collections before
After Fit Tribe collections after
03
Product Detail Page
Social proof, size clarity, cold-traffic persuasion
Before Fit Tribe PDP before
After Fit Tribe PDP after
04
Cart
Friction removed, upsells added, mobile-optimized
Before Fit Tribe cart before
After Fit Tribe cart after
The Results
Traffic Up 21%. CVR: 0.7%1.86%.

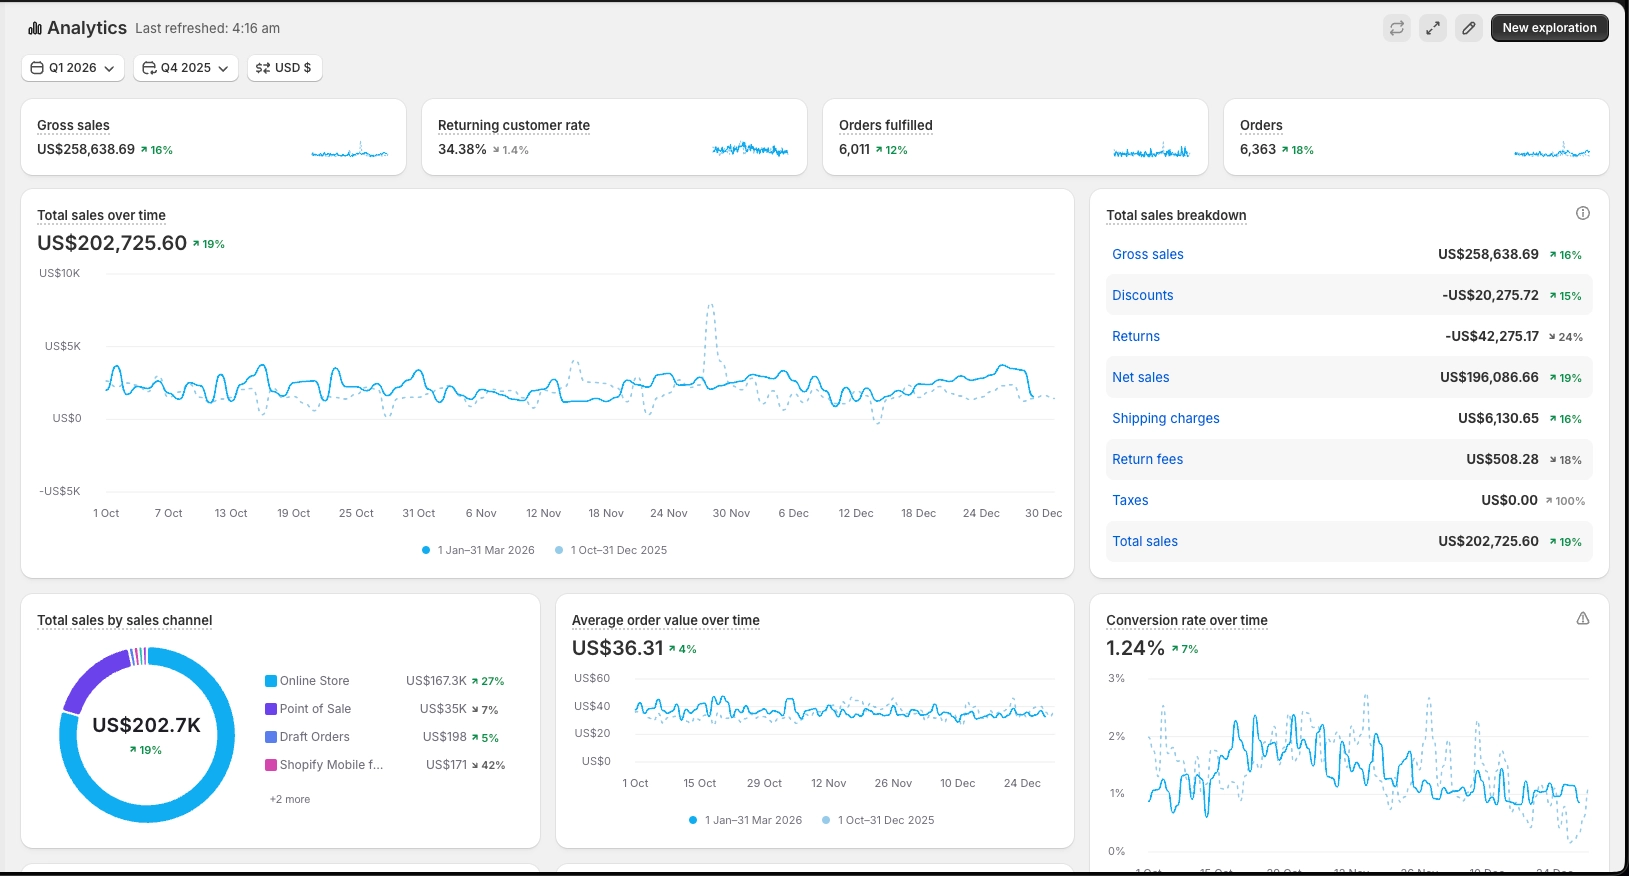
Without our optimizations, blended CVR was on track to collapse to an estimated ~0.70%, TikTok at 40% of traffic converting at 0.1% compounded a general channel-wide CVR drop of ~16%. We held it at 1.24%. After TikTok budget was re-allocated to Meta, the actual largest traffic driver, CVR rose to 1.86%. The site had been rebuilt to convert across all channels, not just compensate for TikTok's drag.
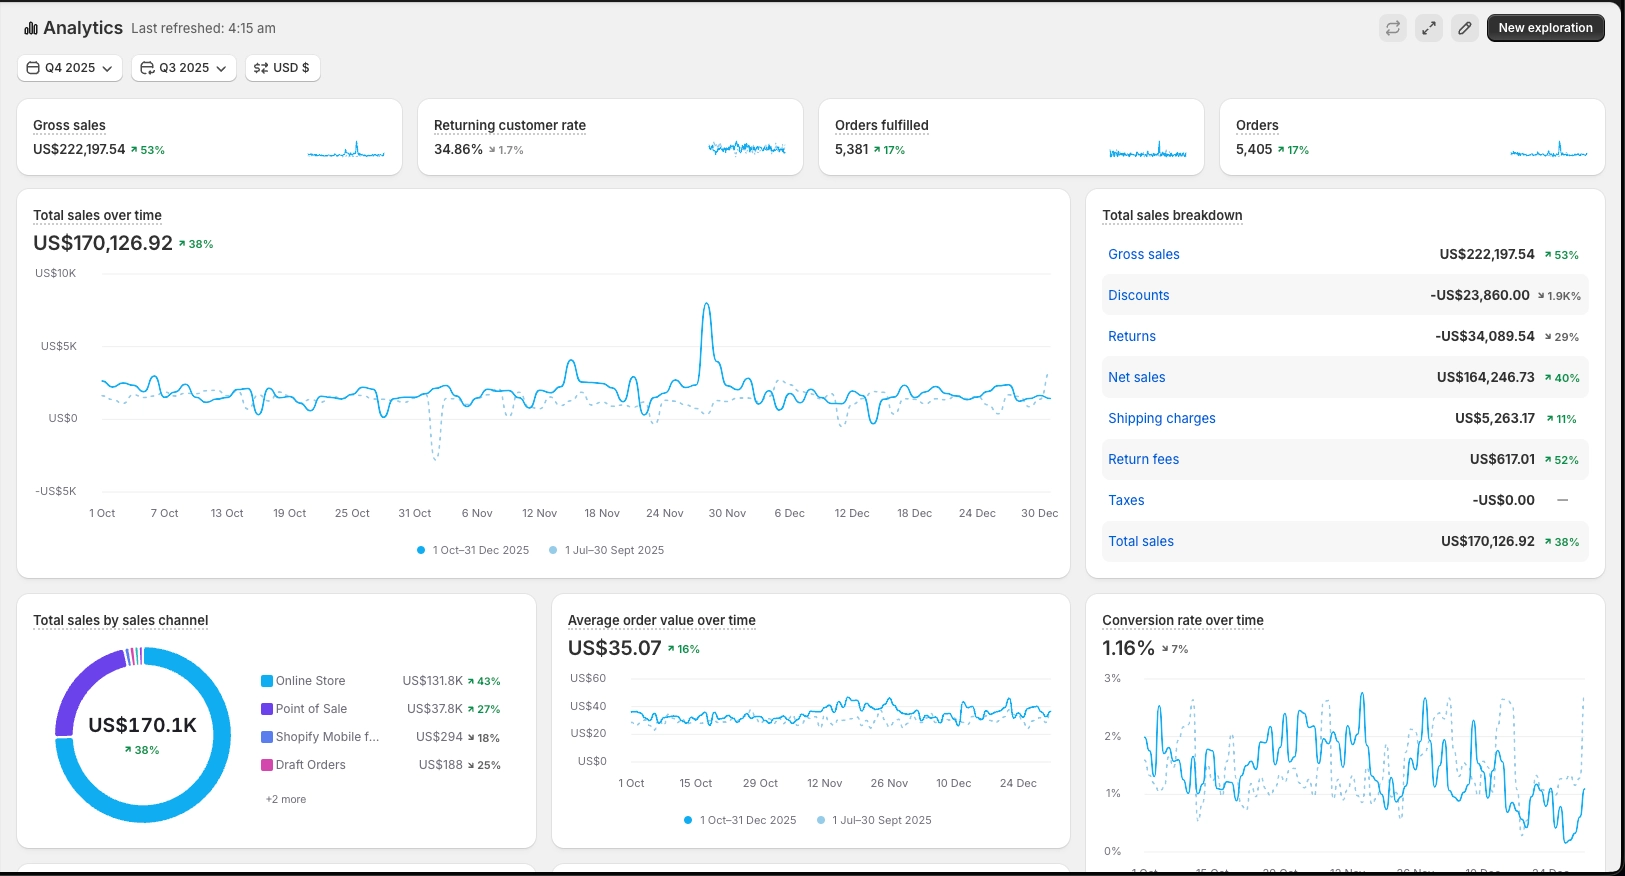
Before, Q4 2025 Fit Tribe analytics before, Q4 2025: 352K sessions, E£8.67M revenue, 1.16% CVR
Q4 2025 · 352K sessions · E£8.67M revenue (~$170K USD) · 1.16% CVR
After, Q1 2026 Fit Tribe analytics after, Q1 2026: 424K sessions, E£14.1M revenue, 1.24% CVR
Q1 2026 · 424K sessions · E£14.1M revenue · 1.24% CVR
Sessions Growth
+21%
352K → 424K. Scaled across all channels, Meta the largest driver.
Revenue
E£14.1M
In 4 months. Up from E£8.67M the prior quarter.
CVR Improvement
1.16% → 1.86%
1.24% with TikTok (40% of traffic at 0.1% CVR). 1.86% after TikTok budget re-allocated.
CVR Growth (Est.)
+166%
~0.70% floor (TikTok at 0.1%, 40% of traffic) → 1.86% after re-allocation

"TikTok made up 40% of traffic and converted at 0.1%. The blended CVR still went up because we fixed what the site was losing on its own traffic. After TikTok budget was re-allocated, CVR reached 1.86%."

, Scalo · Fit Tribe Engagement, Q4 2025 – Q1 2026
Internal Use
🔒
Enter passphrase
This section is access-controlled.
Interview Layer · Confirmation Questions & Sourcing Notes

Incorrect passphrase.

✓ Confirmed, Sourced from Steven's brief
  • Q4 2025 baseline: 352K sessions / $170K revenue / 1.16% CVR
  • Q1 2026 result: 424K sessions / $202K revenue / 1.24% CVR
  • +21% traffic, +16% revenue, CVR maintained and improved
  • TikTok made up ~40% of traffic during engagement
  • TikTok CVR previously ~2%, fell to ~0.1% at time of engagement
  • After TikTok budget re-allocated: CVR rose to 1.86%
  • Project scope: 30-day sprint
  • Work included: navigation, search, collection filtering, PDPs, cart rebuild
  • Client site: fittribeeg.com
  • Comparison period: Q4 2025 (before) vs. Q1 2026 (after Scalo engagement)
⚠ Inferred, Needs confirmation before publishing
  • "8-figure brand" label, confirm Fit Tribe is comfortable with this characterization
  • TikTok CVR numbers (2% → 0.1%), confirm exact figures or adjust framing to "approximately"
  • CVR rise to 1.86% after TikTok budget re-allocated, confirm timing and attribution
  • "Premium positioning" language, confirm Fit Tribe's price tier/positioning intent
? Open Questions, Required before finalizing
  • What is the single most important result Fit Tribe wants highlighted on this page?
  • What were the exact project start and end dates?
  • Are there any results or metrics that should NOT be publicly disclosed?
  • Can we name TikTok specifically, or should it be "social traffic"?
  • Is there a client quote or testimonial we can use?
  • After homepage, PDP, and cart screenshots, where are they saved?
  • What should the after homepage screenshot be? (Currently placeholder)